Overview
- The K-means clustering method divides a set of points in an n-dimensional space into multiple groups called clusters, which are centred around certain points called centroids.
- The grouping is done based on the proximity of the data points to the centroid. Initially these centroids are chosen randomly or given initial values.
- Subsequently, the Euclidean distance between each point to each centroid is calculated. For a point p1, d1 and d2 are distances to centroids c1 and c2. Among d1 and d2, if d1 is smaller then p1 is assigned to the cluster g1. If d2 is smaller then the point p1 is assigned to the cluster g2.
- During the next iteration the means of the points in each cluster are calculated and assigned as new centroids. The process is repeated until there is no significant change in the centroids between two iterations.
- K-means clustering is an unsupervised learning technique. In unsupervised learning technique, the data is not tagged/labelled. There are no predefined groups. The k-means algorithm divides similar data into multiple groups called clusters using centroids.
- The other unsupervised learning techniques include dimension reduction, association rules and other clustering methods like hierarchical clustering and gaussian mixture models.
K-means clustering using SciPy
- The function kmeans() from the scipy.vq module of the SciPy library provides an implementation of the k-means clustering algorithm.
- Using parameter k_or_guess, a given number of random points from the data can be chosen as initial centroids or specific centroids can be passed.
- Using the optional parameter iter, the number of iterations can be specified after which the function returns the final centroids.
- Instead of specifying the number of iterations, the threshold of the distortion (mean value of the distances from points to centroids) can be specified using the optional parameter threshold.
- To get the exact centroids during next run of the program the optional, parameter rng can be used for specifying a random seed.
Applications of k-means clustering
- K-means clustering is used in medical imaging for diagnosis of various disease conditions using CT, MRI and other modalities.
- Outliers in each cluster can be easily found using K-means clustering including the extreme among them. Hence K-means clustering is often used in anomaly detection applciations.
Example
# Example Python program that creates clusters

            # of data points using centroids obtained through k-means

            # algorithm. The example uses kmeans() function from the scipy.vq

            # module of the scipy library

# Data courtesy - data collected from the following sources

            #https://sora.unm.edu/sites/default/files/journals/wilson/v029n03/p0164-p0165.pdf

            #https://www.researchgate.net/publication/24032337_Genome_size_is_inversely_correlated_with_relative_brain_size_in_parrots_and_cockatoos

            #https://onlinelibrary.wiley.com/doi/full/10.1002/cne.25112

            #https://archive.reading.ac.uk/news-events/2020/December/pr852897.html

            #https://www.open.edu/openlearn/science-maths-technology/mathematics-statistics/exploring-data-graphs-and-numerical-summaries/content-section-2.6

            #https://www.sciencedirect.com/topics/agricultural-and-biological-sciences/hippopotamus

            #https://www.coloradocollege.edu/dotAsset/17493d76-5085-4a01-a757-d992278a9eaf.pdf

            #https://faculty.washington.edu/chudler/facts.html

import numpy as np

            from scipy.cluster.vq import vq, kmeans, whiten

            import matplotlib.pyplot as plt

livingBeings = ["Bald eagle", "Green winged amazon  Parrot",

                            "Crow", "Sparrow", "Peacock", "Hen", "Seagull",

                            "Snowy Owl", "Crane", "Duck", "Atlantic salmon",

                            "Eel", "Frog", "Small Tortoise", "Saltwater crocodile",

                            "Panda", "Great white shark", "Dolphin", "Cow", "Horse",

                            "Red fox", "Wolf", "Hippopotamus", "Rhinoceros", "Zebra",

                            "Chimpanzee", "Human", "Tiger", "Lion", "Bear"]

features  = np.array([[5,     0.011987], [0.5,    0.01365], [0.45,   0.00725],

                                 [0.3,    0.001], [5,      0.003], [2.5,    0.003],

                                 [1.8,    0.012], [2,      0.022], [5,      0.015],

                                 [1,      0.065], [5,      0.0075], [3.7,    0.29],

                                 [0.022,  0.24], [0.125,  0.35], [600,    0.015],

                                 [85,     0.3], [890,    0.035], [400,    1.65],

                                 [680,    0.45], [500,    0.7], [4.3,    0.047],

                                 [36,     0.12], [1600,   0.5], [1100,   0.5],

                                 [400,    0.4], [50,     0.375], [62,     1.35],

                                 [240,    0.28], [320,    0.24], [100, .250]])

# Create six centroids

            centroids, distortion = kmeans(features, 6)

            print("Centroids:")

            print(centroids)

print("Distortion:")

            print(distortion)

#print(features[:, 0], features[0:,1])

figr   = plt.figure()

            axis   = plt.gca()

            # Scatter plot of body weights vs brain weights

            axis.scatter(features[:, 0], features[0:,1])

# Mark the centroids hence creating clusters

            axis.scatter(centroids[:,0], centroids[:,1])

# Set logrithmic scale

            axis.set_yscale('log')

            axis.set_xscale('log')

# Label the graph

            axis.set_title("K-Means clustering:Body weight vs Brain weight")

            axis.set_xlabel('Body weight')

            axis.set_ylabel('Brain weight')

# Annotate the data points

            for i in range(0, 30):

                   text = livingBeings[i]

                   axis.annotate(text, features[i])

plt.show()
Output
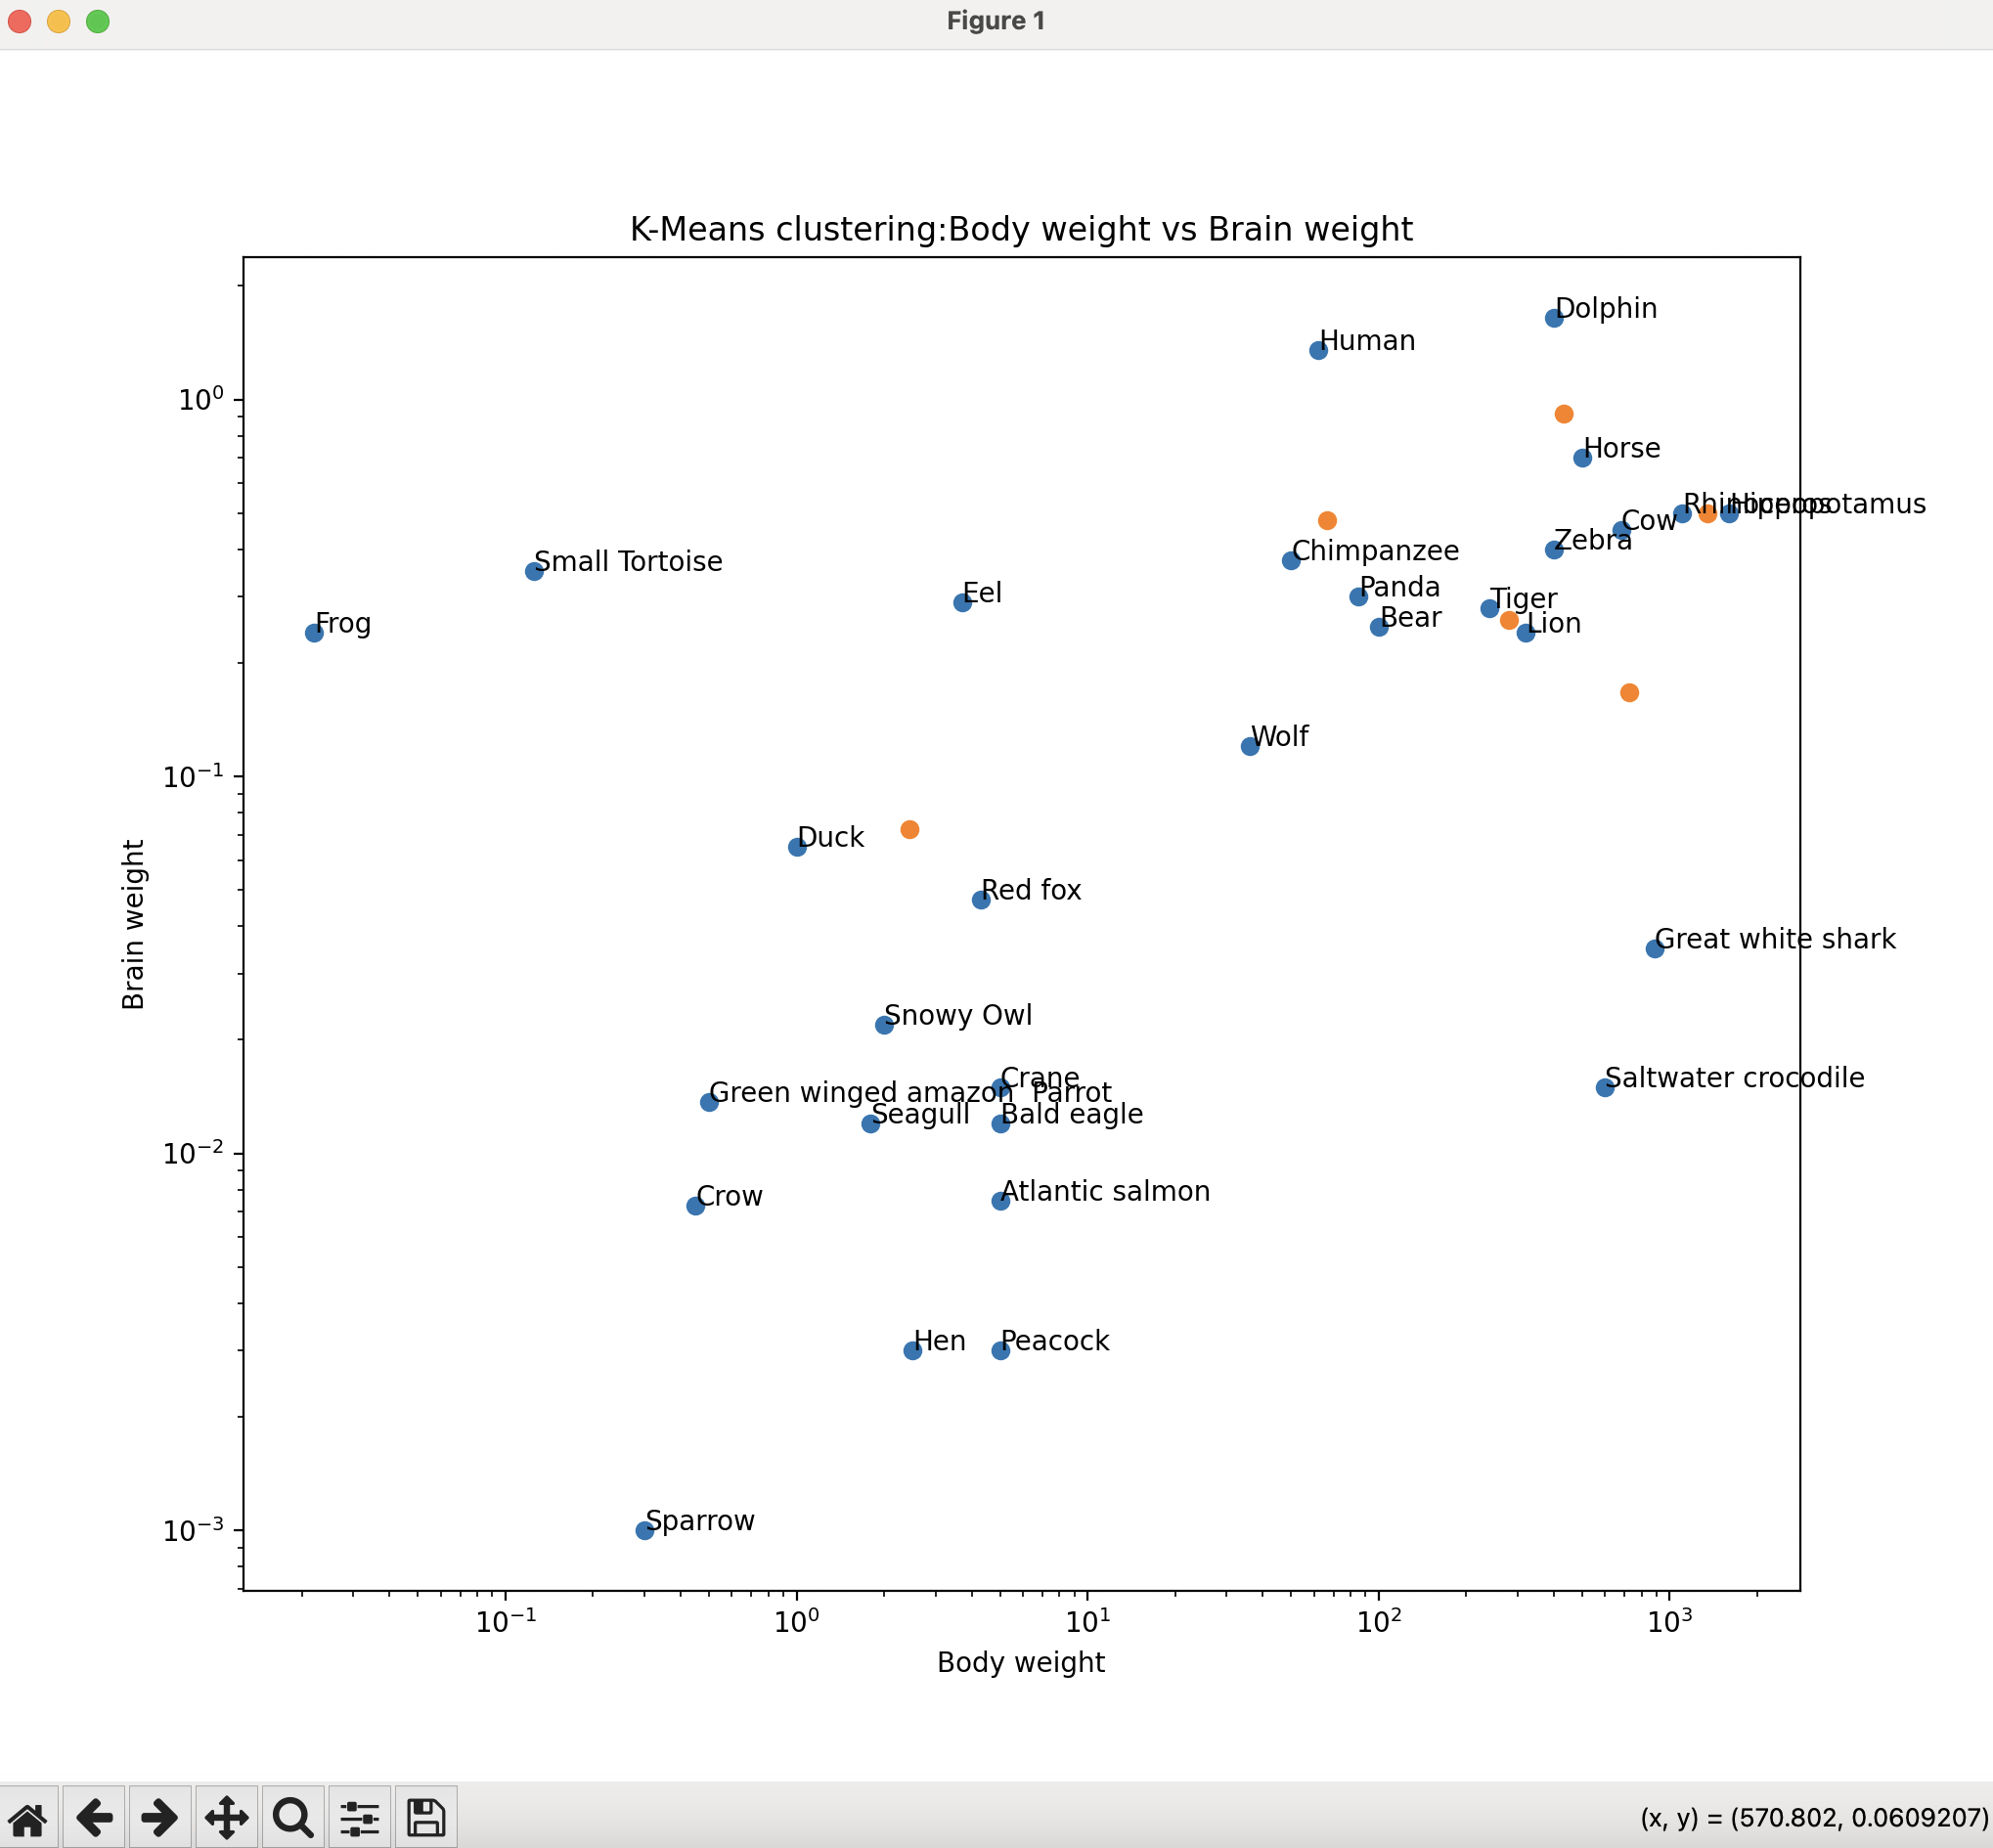
Centroids:

            [[9.95000000e+02 2.67500000e-01]

             [2.80000000e+02 2.60000000e-01]

             [5.16000000e+02 6.43000000e-01]

             [1.60000000e+03 5.00000000e-01]

             [6.66000000e+01 4.79000000e-01]

             [2.44646667e+00 7.25591333e-02]]

            Distortion:

            30.55101435810559