Overview
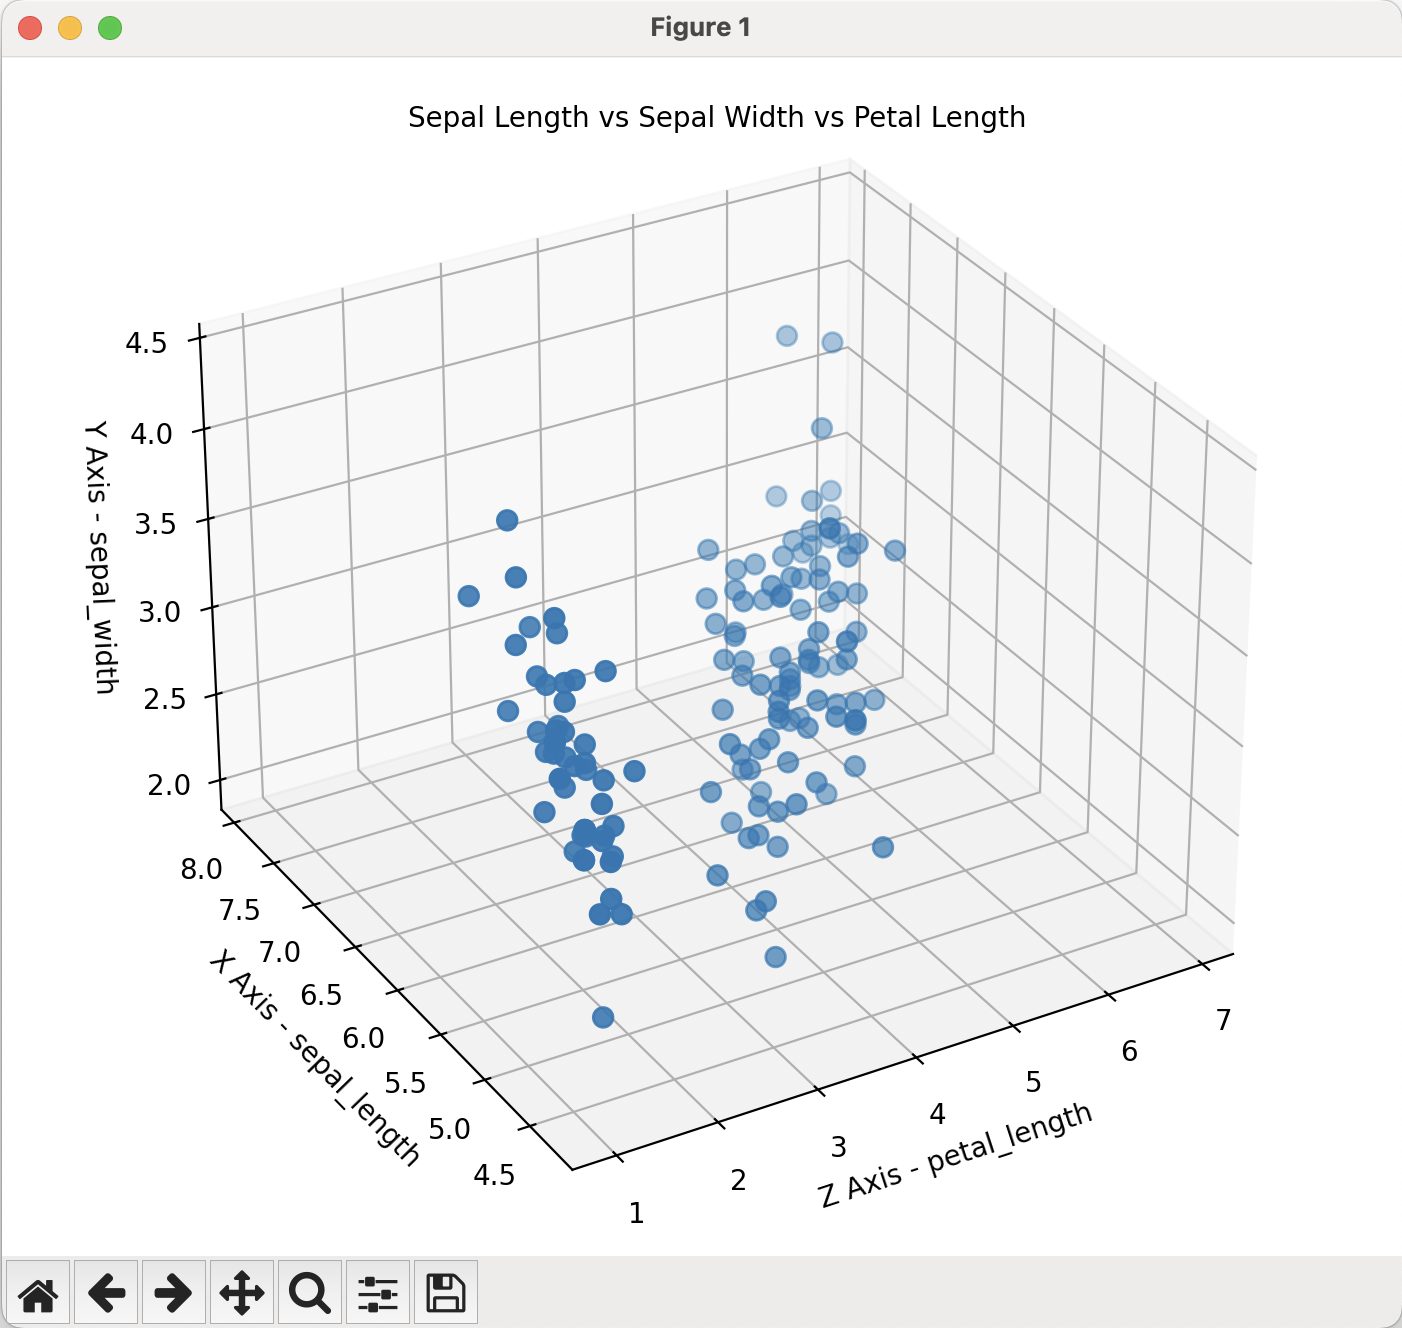
- A 3-d scatter plot marks how a dependent variable behaves in accordance with two other independent variables.
- A 3-d scatter plot is drawn using a given dataset consisting of (X, Y, Z) data points a.k.a. trivariate data - where X, Y are independent and Z is dependent on X, Y.
- The X axis is the horizontal axis, the Z axis is the depth axis and the Y axis is the vertical axis.
Example
# Example Python program that uses csv.reader

            # class to read from the iris dataset i.e., iris.csv

            # and plots a 3d-scatter plot of (sepal length-X,

            # sepal width-Y, petal length - Z)

            import csv

            import matplotlib.pyplot as plt

            import numpy as np

            from matplotlib import cm

plt.style.use('_mpl-gallery')

sepal_lengths = []

            sepal_widths  = []

            petal_lengths = []

# Read from the CSV file

            with open('iris.csv', newline='') as QuoteFile:

                csvReader = csv.reader(QuoteFile, delimiter=',')

                rowIndex = 0

    for row in csvReader:

                    if rowIndex == 0:

                        rowIndex = rowIndex + 1

                        continue

        rowIndex = rowIndex + 1

                    sepal_lengths.append(row[0]);

                    sepal_widths.append(row[1]);

                    petal_lengths.append(row[2]);

sepal_lengths_np   = np.array(sepal_lengths, dtype=float)

            sepal_widths_np    = np.array(sepal_widths, dtype=float)

            petal_lengths_np   = np.array(petal_lengths, dtype=float)

# Plot

            fig, ax = plt.subplots(subplot_kw={"projection": "3d"})

# Set the graph size

            fig.set_size_inches(7, 6)

ax.view_init(vertical_axis='y', elev=30, azim=-120, roll=0)

            ax.scatter(sepal_lengths_np, sepal_widths_np, petal_lengths_np, s = 50)

# Labels and title

            ax.set_xlabel('X Axis - sepal_length')

            ax.set_ylabel('Y Axis - sepal_width')

            ax.set_zlabel('Z Axis - petal_length')

            ax.text2D(0.25, 0.95,

                        "Sepal Length vs Sepal Width vs Petal Length",

                        transform = ax.transAxes)

plt.show()
Output