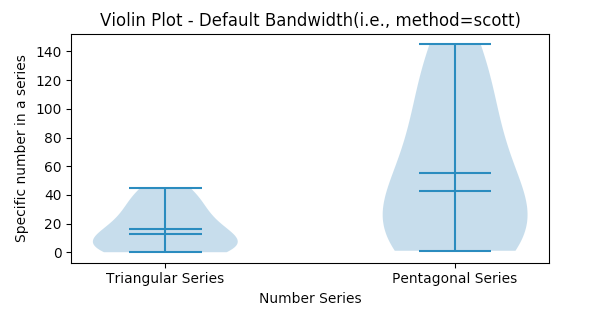
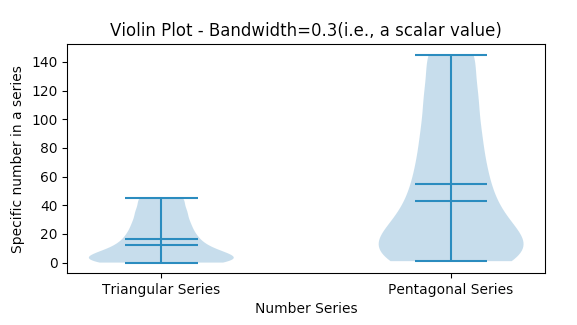
A violin plot combines the Kernel Density Estimation Plot and the Box plot. It displays the whole distribution along with the probability density function, median and mode information.The python matplotlib example draws violin plots with different bandwidth values applied.
A violin plot combines two aspects of a distribution in a single visualization:
The features of a Box Plot: Median, Interquartile Distance
The Probability Density Function
In a violin plot, the Probability Density Function-PDF of the distribution is tilted side wards and placed on both the sides of the box plot.
A violin plot clearly displays the multiple modes present in a multi-modal data.
Violin plots display the whole distribution. They do not display outliers separately as in case of Box plots.
Drawing a violin plot using Python and Matplotlib
To create a violin plot, import the matplotlib.pyplot module and call the method violinplot() function by passing the data as sequences.
The violin plot can be customized to display mean and median values.
Using Matplotlib both vertical and horizontal violin plots can be created through the parameter vert. By default the value of the vert parameter is True, which creates a vertical violin plot. The width of the violin can be controlled by the widths parameter.
Example
python
# Example python program to draw a violin plot using matplotlib

import matplotlib.pyplot as plot

import pandas as pd

import numpy as np

# Customized method to draw violin plot in a matplotlib subplot

def drawViolinPlot(axis, xlabel, xticks, xticklabels, ylabel, bandwidth, title):

    # Customize x-axis

    axis.set_xlabel(xlabel);

    axis.set_xticks(xticks);

    axis.set_xticklabels(xticklabels);

    # Customize y-axis

    axis.set_ylabel(ylabel);

    # Draw a violin plot for the distributions - Default bandwidth

    axis.violinplot(sequences, showmeans=True, showmedians=True, bw_method=bandwidth);

    axis.set_title(title);

# Distributions as python lists

triangularSeries = [0, 1, 3, 6, 10, 15, 21, 28, 36, 45];

pentagonalSeries = [1, 5, 12, 22, 35, 51, 70, 92, 117, 145];

# A tuple of distributions

sequences = (triangularSeries, pentagonalSeries);

figure, axis = plot.subplots(2, 1);

plot.subplots_adjust(hspace=1);

bandwidth = None;

drawViolinPlot(axis[0],

              "Number Series",

              np.arange(len(sequences)+1),

              ('', 'Triangular Series', 'Pentagonal Series'),

              "Specific number in a series", bandwidth,

              "Violin Plot - Default Bandwidth(i.e., method=scott)");

bandwidth = 0.3;

drawViolinPlot(axis[1],

              "Number Series",

              np.arange(len(sequences)+1),

              ('', 'Triangular Series', 'Pentagonal Series'),

              "Specific number in a series", bandwidth,

              "Violin Plot - Bandwidth=0.3(i.e., a scalar value)");

# Display violin plot

plot.show();
Output
Your privacy choices
We'd like to use Google Analytics cookies to count visits and see which tutorials are useful.
They are only set if you accept. We don't use advertising cookies and we don't sell your data.
You can change your choice any time from “Your privacy choices” at the bottom of every page.
Privacy Policy
Your privacy choices
Your browser sent a Global Privacy Control signal, so analytics is off unless you turn it on here.
Strictly necessary
Remembers this choice in your browser. No cookies, nothing sent to anyone.Always on